Let’s dive into the world of market making and options trading through the lens of a small but mighty market maker with a $100,000 portfolio. This is the story of how precision, not prediction, keeps professional liquidity providers in the game; and how MajorWager helps retail traders ride the waves those precision-driven hedges leave behind.
The Scenario
Our market maker is tasked with facilitating two customer trades assuming no liquidity:
- Customer A buys 100 AAPL call options (strike price $105) while AAPL is trading at $105.
- Customer B sells 50 TSLA call options (strike price $110) while TSLA is trading at $110.
To provide liquidity, the market maker must take the other side of these trades. That means:
- Short 100 AAPL Calls (each contract controls 100 shares)
- Long 50 TSLA Calls
But remember: market makers aren’t in the business of betting. They must neutralize risk.
Step 1: AAPL Risk Enters the Portfolio
We start by looking at the delta, gamma, and vega risk from the AAPL call position.
Delta Exposure from AAPL Call Position
- The market maker is short delta because they sold the calls.
- If AAPL goes up, they lose money unless they hedge by buying stock.
Gamma Exposure from AAPL Position
- Gamma is highest at the strike price.
- The closer AAPL stays to $105, the more unstable the market maker’s delta becomes.
Vega Exposure from AAPL Position
- Volatility hurts here. If implied volatility rises, the calls become more valuable.
- Our MM loses as the short position gains value.
AAPL Option Exposure Table
| Greek | Exposure | Description |
|---|---|---|
| Delta | -5000 | Short 100 AAPL calls (delta negative) |
| Gamma | -200 | Short 100 AAPL calls (gamma negative) |
| Vega | -1000 | Short 100 AAPL calls (vega negative) |


Step 2: Enter TSLA — A Bit of Relief
Now let’s look at what happens when we add the TSLA call position.
Delta Exposure from TSLA Call Position
- Now we’re long delta because we own the TSLA calls.
Gamma Exposure from TSLA Position
- Gamma is positive here, which helps balance the earlier negative gamma.
Vega Exposure from TSLA Position
- Vega is also positive here, giving us a little help on the volatility front.
TSLA Option Exposure Table
| Greek | Exposure | Description |
| Delta | +2500 | Long 50 TSLA calls (delta positive) |
| Gamma | +125 | Long 50 TSLA calls (gamma positive) |
| Vega | +750 | Long 50 TSLA calls (vega positive) |


Step 3: The Combined Picture
Now let’s see what the entire portfolio looks like.
Net Delta Exposure
- Still short overall. Need to hedge with stock.
Net Gamma Exposure
- Still negative, but improved with TSLA exposure.
Net Vega Exposure
- Slightly negative. We still lose if volatility rises too much.
Combined Option Portfolio Exposure
| Greek | AAPL Exposure | TSLA Exposure | Net Exposure | Hedging Goal |
| Delta | -5000 | +2500 | -2500 | Buy 2,500 shares of stock |
| Gamma | -200 | +125 | -75 | Add gamma-positive options |
| Vega | -1000 | +750 | -250 | Buy vega-rich options |


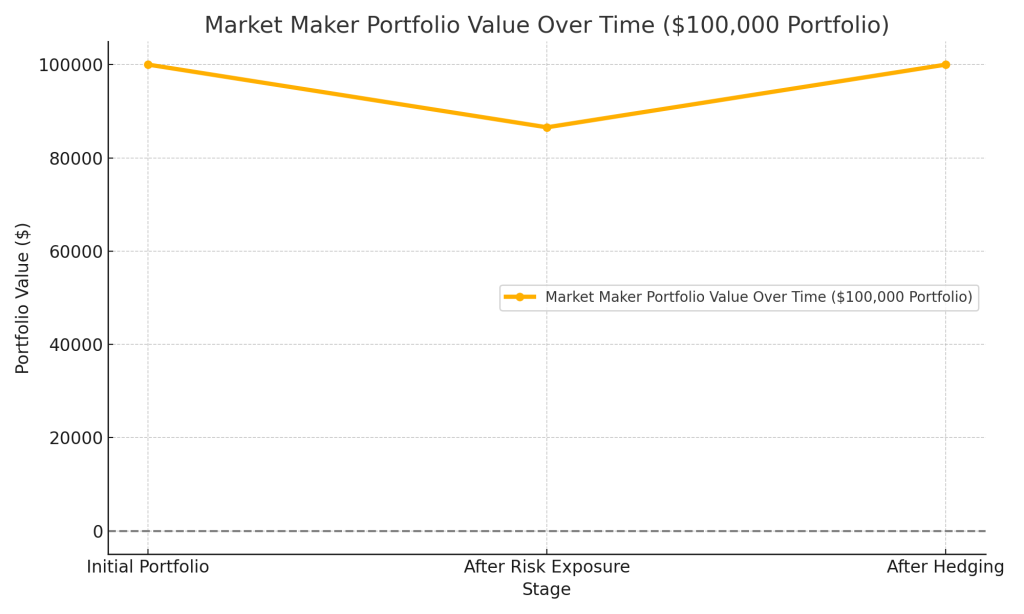
Step 4: Impact on the $100,000 Portfolio
So what does this all mean for our market maker’s account?
Portfolio Value Table
| Stage | Portfolio Value ($) | Delta PnL | Gamma PnL | Vega PnL | Total Change |
| Initial | 100,000 | 0.00 | 0.00 | 0.00 | 0.00 |
| After Risk | 86,550 | -12,500 | -937.5 | -12.5 | -13,450 |
| After Hedge | 100,000 | 0.00 | 0.00 | 0.00 | 0.00 |
Portfolio Value Over Time
Even with a small portfolio, we see how powerful good risk management is. After hedging, the market maker is right back to even.

The Seesaw Analogy
Think of these hedges as tools to stabilize a seesaw:
1. Delta Hedge: Balances the seesaw for small weight changes (minor price moves).
2. Gamma Hedge: Prevents the seesaw from tipping too much if someone moves quickly or adds weight suddenly (big price moves).
3. Vega Hedge: Accounts for unpredictable weather that might change the weight of objects on the seesaw (volatility).
A good market maker keeps this seesaw level through constant adjustment.
Final Thoughts
This example shows how even $100,000 portfolio can teach us everything about professional options trading for Market Makers:
- It’s not about guessing direction.
- It’s about managing exposure.
- Market makers are liquidity providers, not gamblers.
Next time you trade an option, know that someone on the other side is working hard to keep their seesaw balanced.
And this is exactly where MajorWager steps in partly. By tracking these hedging flows in real time, MajorWager identifies the micro-trends created by market makers as they rebalance their portfolios. These movements, driven not by sentiment but by structural obligations, can create short-term momentum that retail traders can ride. When market makers hedge, they move the stock — and MajorWager helps you see where they’re likely to act. That’s how retail can finally catch the biggest players of the day in real-time action.
This post is inspired by foundational concepts from Professor Yuh-Dauh Lyuu’s graduate-level courses at National Taiwan University, including Principles of Financial Computing, Financial Engineering and Computation, and Financial Computation.
Works Cited
Lyuu, Yuh-Dauh. Principles of Financial Computing. National Taiwan University, 9 May 2007, www.csie.ntu.edu.tw/~lyuu/finance1/2007/20070509.pdf. Accessed 01 Mar. 2022.
Disclaimer: This post is for educational purposes only and reflects my personal views—not financial advice.